Understand where every euro of your boat goes.
Financial dashboard, automatic expense categorisation, cost per mile, benchmark vs. Knowledge Base. Numbers that actually help.
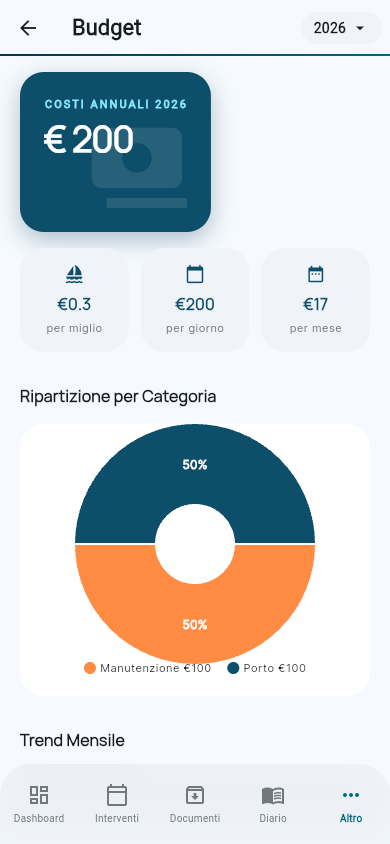
What it does
Automatic categorisation
Invoices uploaded via OCR land in the right category: engine, sails, mooring, insurance, fuel.
Cost per mile
KLABBY computes how much each nautical mile actually costs you, including maintenance and depreciation. Ugly numbers, useful.
Knowledge Base benchmark
For each expense category, the "typical" cost is shown. See if you're in line or someone's overcharging you.
Co-ownership-aware
Expenses split per co-ownership rules: fixed by share, variable by usage days. Clean statement per member.
In practice: end of season, 18,000€ spent
Open November dashboard. 32% mooring (in line with benchmark), 28% maintenance (+15% above avg — why?), 18% fuel (3 new trips this year). You decide next year less yard service, more local mechanic.
- 1 Uploaded invoices auto-categorised
- 2 Monthly dashboard with your percentages by category
- 3 Instant comparison vs. Knowledge Base benchmark
- 4 Pro-rata statement per member, always up to date
Integrates with
- Documents (OCR invoices become expenses)
- Co-ownership (fixed/variable splitting automatic)
- Knowledge Base (cost benchmark per category)
- Maintenance (total cost per job, history)
Frequently asked
Can I export for my accountant?
Yes. Export CSV or XLSX per fiscal year, with all categorisations and required attachments.
How do you know the "typical" cost?
From the integrated Knowledge Base: average cost standards per boat, engine, region. Indicative but realistic.